Recently I talked with a team porting a PC game to Switch. They had been struggling with the port for a long time and couldn't move forward. I told them the first thing I would do: convert a large part of those actors into instances, so the render thread has far fewer separate things to prepare. They answered that they had consulted several people, and that someone had recently suggested something similar. I don't know whether it solved their problem, because the contact has faded.
I should be clear about what I knew. I knew the game, but I had not seen the project. I was inferring from how the game looks and from how many separate pieces it seems to be made of. A proper profile would probably find more than one cause. But too many actors in the scene is usually the first question to ask and the first suspect I would check.
This is how a scene ends up like that. A game starts with a basic set of elements it needs for its mechanics and gameplay, including the objects that define the playable space and block off its edges. Then the art team starts decorating it, the so-called beauty pass, and more and more elements appear. Nobody audits the scene at the end, because on a PC it runs great: there is headroom left, so there is no reason to ask whether it's optimal. The problem shows up only when you try to port it to a system that is sensitive to volume and has hard limits.
Maybe it's also about how PC developers are used to thinking about hardware. On a PC you swap the processor for a newer one, the graphics card for a more powerful one, you add more RAM and a bigger drive. There is no roof, only upgrades. Then you meet fixed hardware with fixed parameters, and you have to fit something that runs on 16 gigabytes into 3 gigabytes of effective RAM.
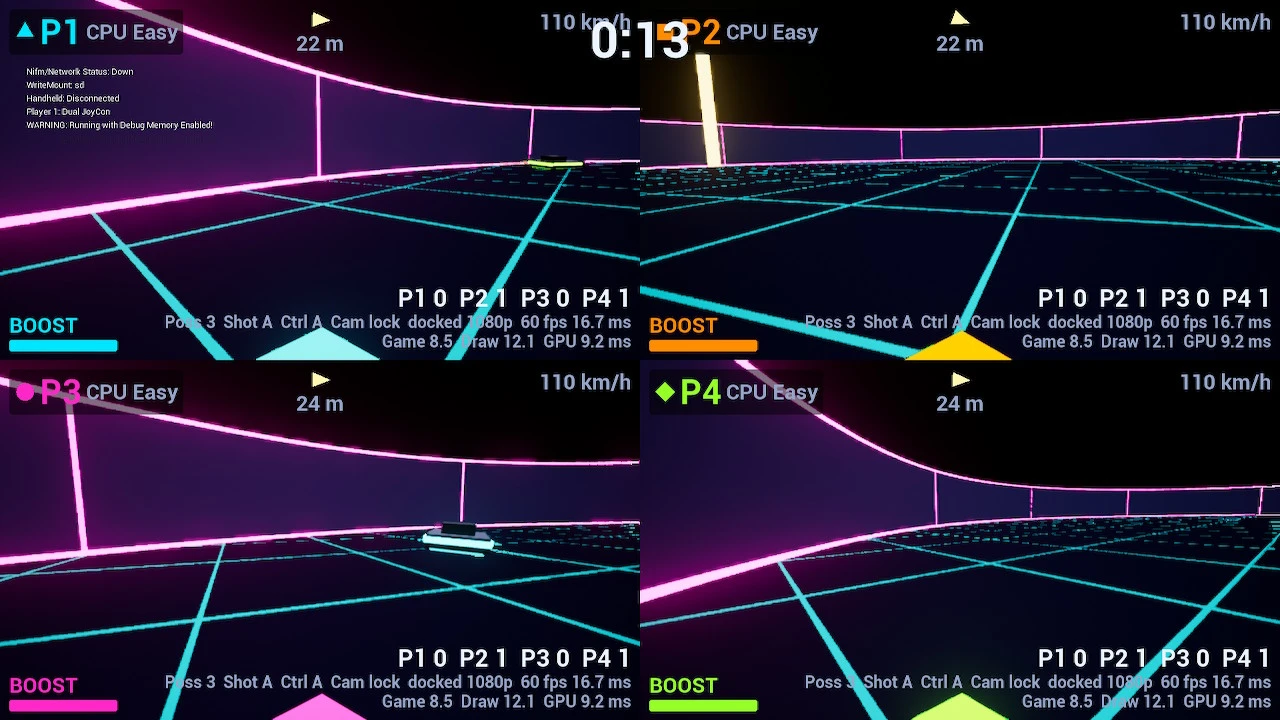
Funny enough, I had the same problem in my own game. Driftorb is a four-player split-screen arcade sport I'm building in Unreal Engine 5 for Nintendo Switch. The arena is deliberately simple: a dark floor, a glowing grid, a circular wall with neon edges, a ball and a moving goal. No textures, no dynamic shadows, no heavy materials. Everything you see is built in C++ from basic engine shapes.
The game itself is just as simple, and that is the point. It is a party game built around a ball and a goal: you play a fast arena match and try to score in the goal. There is only one, and it keeps moving along the edge of the arena. Up to four people can play on one Switch, as a team against a team, so it can be you and a friend against two others, or all four of you against each other. Any seat can be taken over by a bot, which means the same game works as a single-player match against the computer. In that case you get the whole screen to yourself, with a small minimap-style indicator showing where your opponents and the ball are. Matches can be chained into a small tournament.
That is the reason for the four-way split screen, and the reason this article exists: four views of the same arena, on Switch hardware, at 60 fps.
Driftorb is made for Nintendo Switch first and is compatible with Nintendo Switch 2. It is heading into Nintendo's lotcheck, and I hope to release it this year, somewhere around Christmas.
So when the first build on the devkit showed a rock-solid 30 fps, even in the most chaotic moments, it would have been easy to call it done. A simple scene, a stable frame rate, move on.
I didn't, and that turned out to be the most useful decision of the week.
Step 1: Question the number
The in-game counter said "30 fps, 33.3 ms", in handheld and docked mode alike, all the time. That made me suspicious. A real workload fluctuates. A number that never moves usually means I'm measuring a limit, not the work.
It was a limit. The engine's default Switch device profile sets rhi.syncinterval=2, so a frame is presented on every second refresh of a 60 Hz screen: a hard 30 fps cap. My counter measured the interval between frames, and under a cap that interval is always 33.3 ms. It can't tell you whether the frame took 32 ms or 12 ms to produce.
A stable frame rate is not a measurement of headroom. It may only be a measurement of the cap.
Step 2: Measure the right thing
I added a small debug overlay, in the spirit of Unreal's stat unit, showing three numbers per view:
- Game: game thread time (logic, simulation)
- Draw: render thread time (preparing draw commands for the GPU)
- GPU: the graphics hardware itself
These are work times, independent of any frame cap. I also added a debug toggle to switch the cap between 30 and 60.
The first readings were revealing. In handheld mode, capped at 30 fps, the frame was done in about 7.5 ms at its slowest stage. The console was idle for more than half of every frame. With the cap lifted to 60, a single view ran at a stable 60 fps in both modes with 7 to 9 ms to spare.
Step 3: Find the actual bottleneck
Then I turned on all four split-screen views at 60 fps. Docked mode gave me 57 to 61 fps, almost there:
| Game | Draw | GPU | |
|---|---|---|---|
| Docked, 4 views | 8.7–9.4 ms | 15.1–17.4 ms | 8.2–9.1 ms |
The GPU had plenty of room. The logic was fine. The problem was Draw, the render thread, poking above the 16.7 ms budget of a 60 fps frame.
That changes the question completely. If the GPU had been the bottleneck, I'd be talking about resolution, shaders and post-processing, all things you can see when you cut them. But the render thread doesn't care how pretty things are. It cares about how many separate things it has to prepare.
Step 4: Count the objects, not the polygons
My "simple" arena:
- a circular wall of 96 segments, each made of three boxes (the wall and two neon edges): 288 objects
- 12 vertical neon ribs
- about 40 grid lines on the floor
That's roughly 340 separate meshes, and each had its own dynamic material instance so it could carry its own colour. Unique materials mean the engine can't merge them. Every one becomes its own draw call, and with four views the render thread prepares the whole set four times per frame: well over a thousand draw calls for a scene that looks almost empty.
I built it that way myself, because giving every piece its own material is convenient. It was the right call while I was prototyping and the wrong one once the scene had to run four times over on a Switch. The scene was simple to look at, but not simple for the engine.
The floor grid is the best example. Around 40 separate line objects is not how you would draw a grid if you thought about it for a minute, and someone could rightly ask why it isn't just a material or a shader. The honest answer is that it began as a prototype, partly a test of building things procedurally. It looked fine, so there was no reason to touch it, until performance became the main topic.
That is a good analogy for the team I mentioned at the start. Nobody planned that cost. The pieces were put in, they worked, and they looked good enough that nobody had a reason to question them, until the moment performance had to be taken seriously. Then someone had to go back and think about every one of them.
Step 5: Same picture, far fewer draw calls
Most of those objects are identical apart from their position: every wall segment is the same box in the same colour, and the same goes for the edges, the ribs and the grid lines. That's exactly what instancing is for.
I replaced the individual meshes with four UInstancedStaticMeshComponent groups: walls, edges, ribs and grid. Each group is one mesh, one material and many transforms, so each group is drawn with a single call.
- Draw calls for the arena: about 340 → 4 per view
- Triangles rendered: unchanged
- Visual difference: none. Same geometry, same colours, same glow.
The neon ribs got their own group so the neon toggle can still hide them in one go.
The result
| Draw (render thread) | fps | |
|---|---|---|
| PC, 4 views, before | ~3 ms | 338 |
| PC, 4 views, after | ~3 ms | 338 |
| Switch docked, 4 views, before | 15.1–17.4 ms | 57–61 |
| Switch docked, 4 views, after | 12.4–13.0 ms | 60, stable |
On my PC (an AMD Ryzen 9 8940HX, 64 GB of RAM and an NVIDIA GeForce RTX 5070 Ti) the change made no measurable difference: around 338 fps before and after, with the render thread at about 3 ms either way. A fast CPU simply shrugs off a few hundred draw calls. That's exactly why the problem stayed invisible during development and only showed up on the target hardware.
GPU time on Switch stayed the same (about 9 ms), as expected: I didn't reduce the work the graphics chip does, only the overhead of telling it what to do. Then I overrode the engine's 30 fps cap in the project's own device profile. Driftorb now targets 60 fps in both docked and handheld mode, with four players on one screen, and still has headroom left for the neon shaders I'm planning next.
There is one more pass to come. The grid lines will be generated by a shader instead of being 40 separate objects, and they should behave even better that way. I'm curious what the numbers will look like, and I'll update this article with them.
"So how much can you actually gain?"
I get asked this a lot, usually in the form: how much performance can you really squeeze out of a small game?
The honest answer is that it depends entirely on how much waste is in there, and you can't know that before you measure. I remember projects where a cleanup took a game from around 6 fps to a stable 120. I also remember the opposite: projects where we were a few frames short, and every one of those frames was grinding, painful work, because the easy wins were already gone.
Driftorb sits somewhere in between, and it's a small, mobile-class game, which makes it a useful reference. On the Switch the render thread cost dropped by roughly a fifth, while on my PC it didn't move at all. The GPU didn't change anywhere. That's a modest number on paper, yet it was the difference between 57 to 61 fps and a locked 60, and, together with removing the cap, between a game that sat idle at 30 and one that runs at 60 with room to spare.
The percentage matters less than where you land relative to the line. Sometimes a small change moves you across it, and sometimes you need ten of them.
What I took away
- Always profile on the device you ship on. On my PC the fix changed nothing, around 338 fps before and after. On the Switch it was the difference between almost 60 and a locked 60.
- Don't trust a stable number until you know what it measures. My 30 fps was a cap hiding an idle console. I wrote up the other numbers that fooled me, on a phone this time, in Why my phone benchmark kept lying to me.
- Measure per thread. "The game is slow" is not a diagnosis. "The render thread is over budget while the GPU has 7 ms to spare" is.
- Simple-looking scenes can still be expensive. What costs CPU time is the number of objects and draw calls, not how complex the scene looks.
- Per-object material instances quietly kill batching. Giving every mesh its own material instance is convenient, but the engine can then no longer merge them.
- The best optimisations are invisible. I didn't lower resolution, remove effects or simplify the art. Players will never see what changed. They'll only feel that the game runs twice as smoothly.
Even in a scene you'd swear has nothing left to optimise, there's often something that can run better at no visual cost. You just have to look at the right number.
Need someone to look after performance?
If your game or your team needs someone to take care of performance, ask about my availability. I offer performance audits and porting as a service. I specialise in mobile devices as a target for your game, including Nintendo Switch.