My first benchmark told me that a batch of GPU work took 0.00 ms. The batch actually took 4.7 seconds.
That was the moment I stopped trusting the easy numbers and started asking what each one was really measuring. This article is about the small web page I built because of it, and about the five ways a perfectly reasonable timing can be wrong.
The question I couldn't answer
I was porting a console game to Android. The game already ran on Switch, and my test phone has a Mali-G615, which is in roughly the same class as a docked Tegra X1. So raw speed was not what worried me.
What worried me was the shape of the hardware. The Tegra X1 is an immediate-mode GPU. Almost every GPU in an Android phone is a tiler. A renderer that has only ever lived on an immediate-mode chip can trip on things it never had to think about: an extra render pass, a fat G-buffer, a pile of small draw calls.
I had four concrete questions. How much of a frame is the CPU building commands, and how much is the GPU running them? What does one extra render pass really cost on a tiler? Does mediump buy anything on Mali, or is everything fp32 anyway? And how far does the phone fall once it gets warm?
I could answer each of them by instrumenting the engine, but that is days of work per question. So I did what I did with BLOOM and built a small lab in the browser first. The page asks the same questions of whatever GPU stack I can open a URL on, and it takes minutes per device instead of days.
The lab: one HTML file, five questions
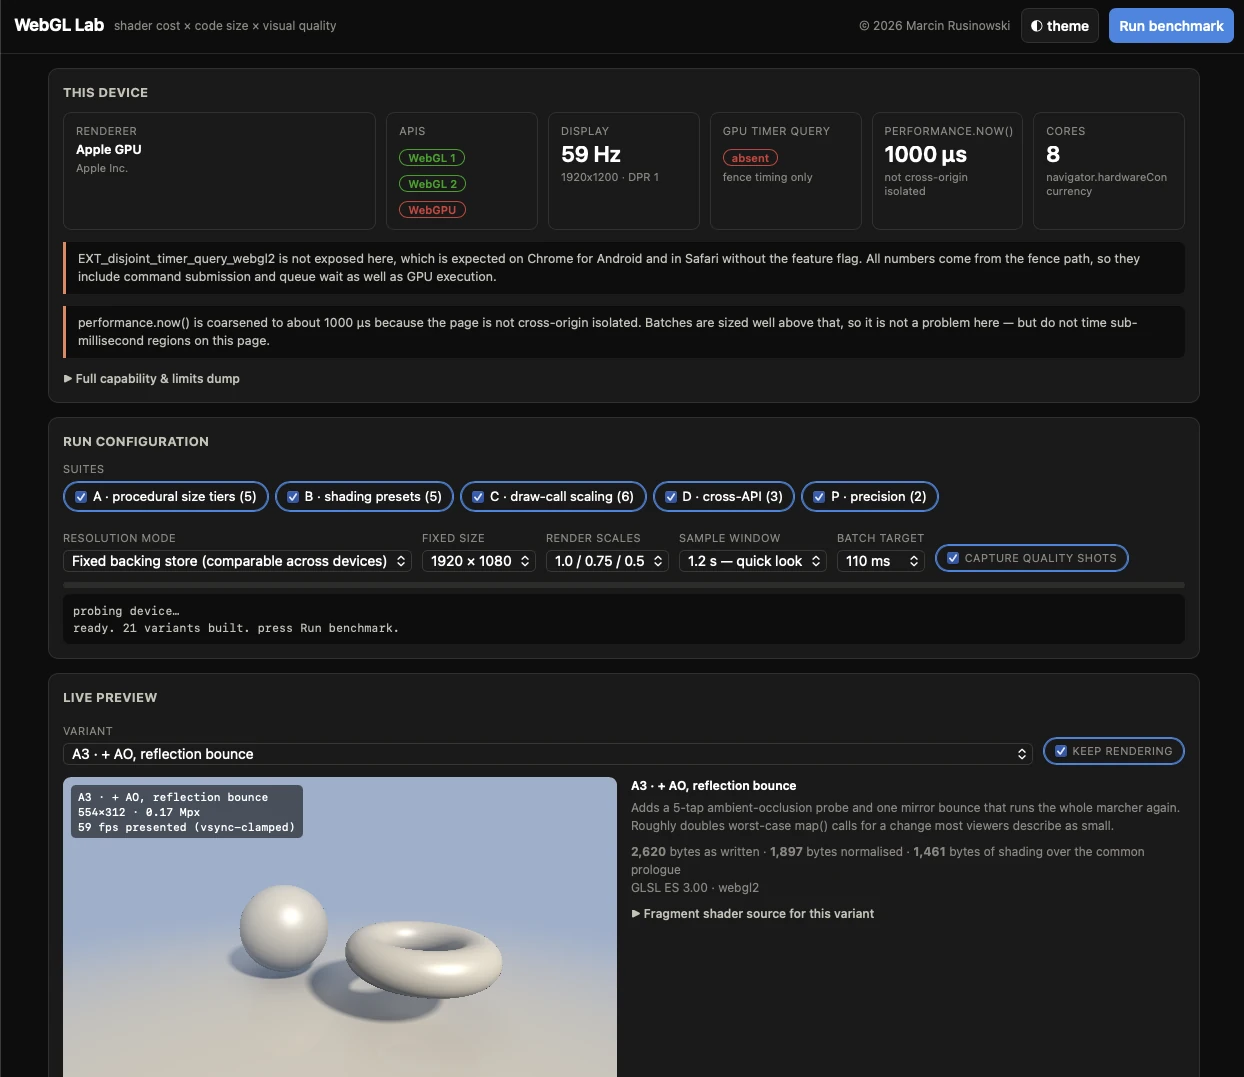
WebGL Lab is a single self-contained HTML file. No server, no install. You open it, press Run benchmark, and it measures five suites, each tied to one question from the port.
| Suite | What changes | What it tells me |
|---|---|---|
| A: shader size | One procedural scene in 5 tiers, from a bare hit test to two bounces with ACES and dither | How cost grows with code size, and whether the extra quality is even visible |
| B: shading presets | One mesh scene: unlit, Lambert, Blinn-Phong, PBR, then PBR plus a shadow map | B4 adds a whole render pass, the tiler question in miniature |
| C: draw calls | 256 or 2,048 instances, from 1 draw up to one draw each | CPU submission cost, isolated |
| D: APIs | The same effect in WebGL 1, WebGL 2 and WebGPU | A rough check across APIs |
| P: precision | One shader at highp and at mediump | Whether fp16 is real on this GPU |
Before it measures anything, the page prints what the device actually is: the renderer string, every WebGL 2 limit next to its spec minimum, the extension list, the WebGPU adapter, and which timing method is available. A number without that context can't be reproduced, so the lab never shows one without it.
Every easy number was a lie
Most of the work went into not fooling myself. Each obvious way of timing GPU work from a web page turned out to measure something else.
FPS measures your monitor. requestAnimationFrame is locked to vsync, so any shader that fits in 16.7 ms reports the same 60 fps, whether it is trivial or nearly full. I saw the same thing in Driftorb, where a "stable" 30 fps was a cap hiding an idle console. So the lab grows every batch until it runs far longer than one refresh, then divides. It reports milliseconds per unit of work, never frames per second.
performance.now() around draw calls measures submission. When a GL call returns, the command has been queued, not executed. On a healthy driver that number barely moves as the shader gets heavier. The lab inserts a fenceSync, flushes, and polls until the GPU says the batch is done.
gl.finish() returned in 0.00 ms for a batch that took 4.7 seconds. That was on WebGL 1, and the next readPixels proved the commands were still in flight. WebGL 1 batches now end with finish() plus a 1×1 readPixels, which forces a real round trip that nobody can skip.
My polling loop was most of my measurement. I polled the fence with setTimeout(…, 0), and once timers nest deeply the browser clamps them to about 4 ms. For a small batch that clamp was most of the time I was "measuring". A MessageChannel message yields just as well, in well under a millisecond.
A lost context hangs forever. If the GPU process resets, the fence never signals and the page looks frozen. Every batch now has a cap, and the run fails loudly instead of sitting there.
The GPU timer extension would have spared me some of this, but EXT_disjoint_timer_query_webgl2 is not exposed by default in Chrome for Android. On a phone, the fence is what you get. The lab shows timer results where they exist and labels which method produced each number.
WebGL is not GL ES with a JavaScript accent
I come from Vulkan and GL ES on Android, so a few things needed unlearning. WebGL 2 is OpenGL ES 3.0 with a mandatory validation layer, minus anything that couldn't be done safely on Direct3D 11. Three differences shape every number the lab produces.
Every draw is validated before it reaches the driver. Index ranges, uniform block sizes, sampler and output types are all checked in the browser and then sent to the GPU process over IPC. A small-draw benchmark mostly measures that, which is exactly why suite C exists.
There are no program binaries either. Every shader is compiled on the user's device, through ANGLE's translator and then the platform compiler. Chrome's shader cache is about 2 MB on Android and gets trimmed when the browser goes to the background, so you can't ship a warm pipeline cache.
And there is no compute, and there won't be. No compute shaders, storage buffers, indirect draws or geometry shaders. Anything GPU-driven lives in WebGPU, not in a future WebGL extension.
The browser also clamps what it tells you. On Android, Chrome caps MAX_SAMPLES at 4 and MAX_TEXTURE_SIZE at 8192, whatever the Mali driver supports natively. It's the same lesson as always: query the limit on the device, never guess it from the chip name.
Phones change under you
A desktop GPU gives you roughly the same answer twice. A phone doesn't. Clocks ramp up, heat builds, the driver throttles. On mid-range Android the gap between peak and sustained performance is often 1.5 to 2.5 times, so which of the two you quote decides your conclusion.
That is why the lab uses fixed durations instead of fixed counts. A fixed count catches a fast device at boost clocks and a slow one after throttling, and the ranking can end up upside down. It reports the median and the p95, never the mean, because one GC pause shouldn't move the headline. And it shows the first third and the last third of every window side by side, plus the drift between them. Running it cold, then again after five minutes of load, is a cheap rehearsal for setting targets at sustained clocks.
There is no thermal API to lean on. The Compute Pressure API only reports CPU pressure today, so throttling has to be read from the drift in the measurement itself.
Everything also renders to an offscreen framebuffer at a fixed size, never to the visible canvas. Compositing and devicePixelRatio stay out of the numbers, and a phone and a desktop push exactly the same pixel count.
What the phone said
First, what this is and isn't. It was a quick look: 1.2 second windows, 1920×1080 offscreen, one Android phone, one iPhone and my Mac for comparison. The proper run, cold and then again after five minutes of load, is still ahead of me. So take this as a sketch.
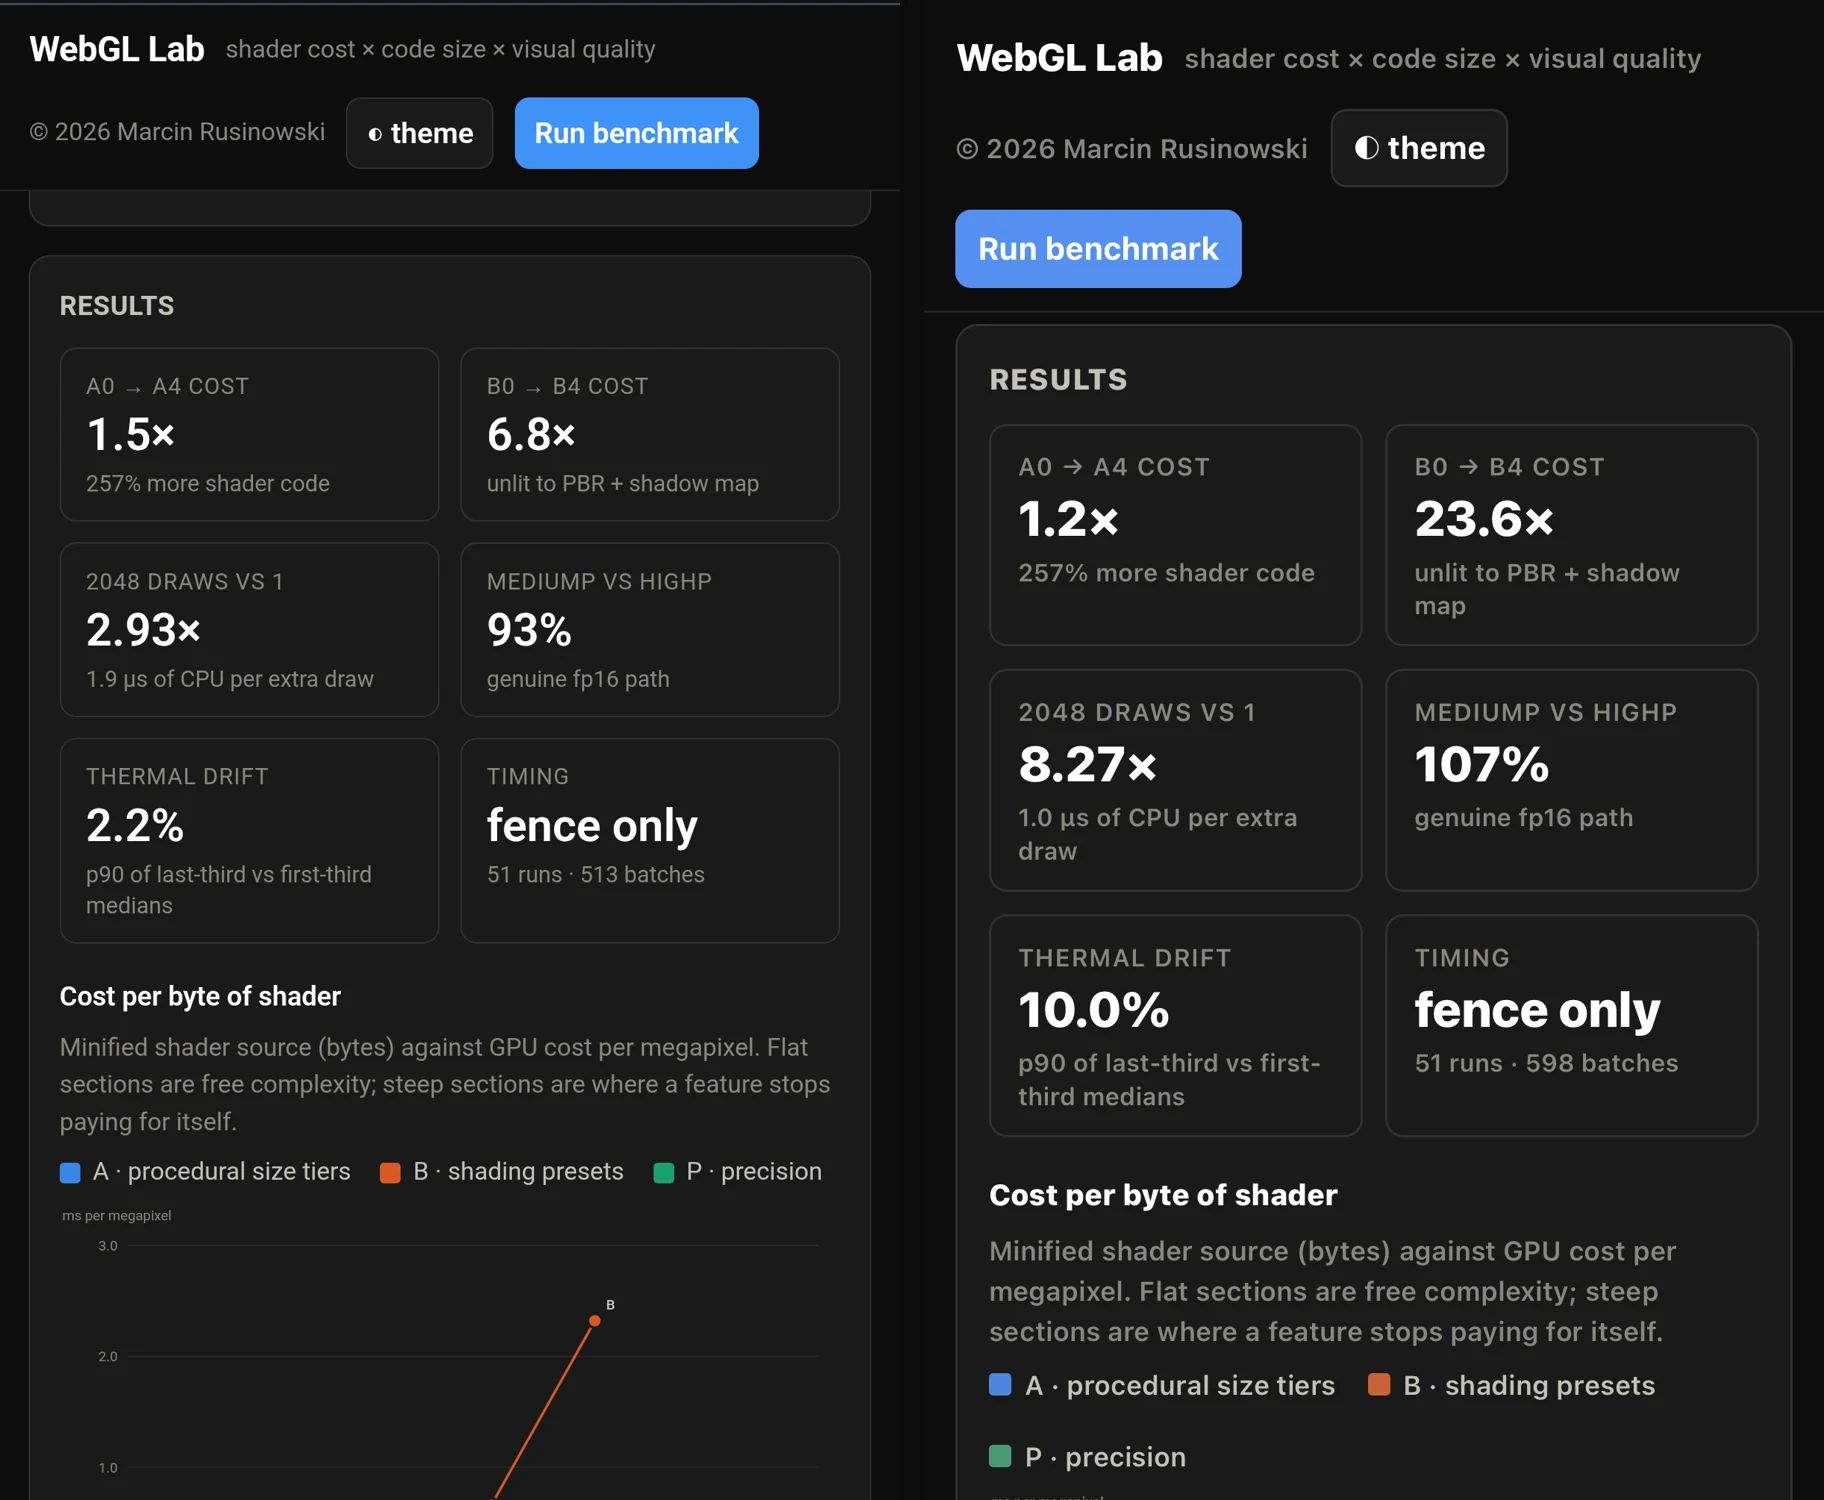
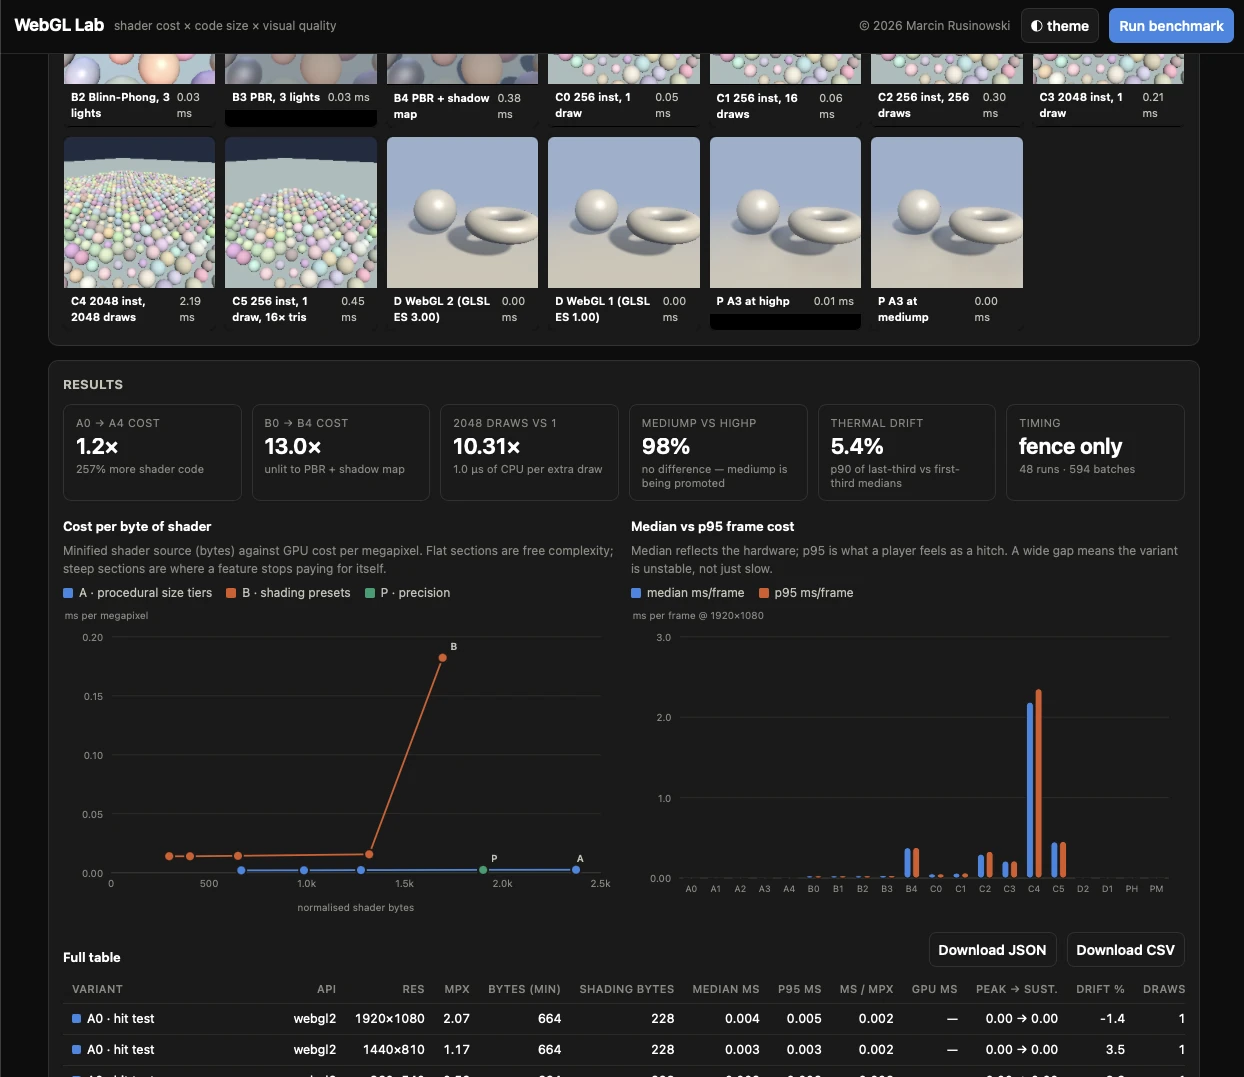
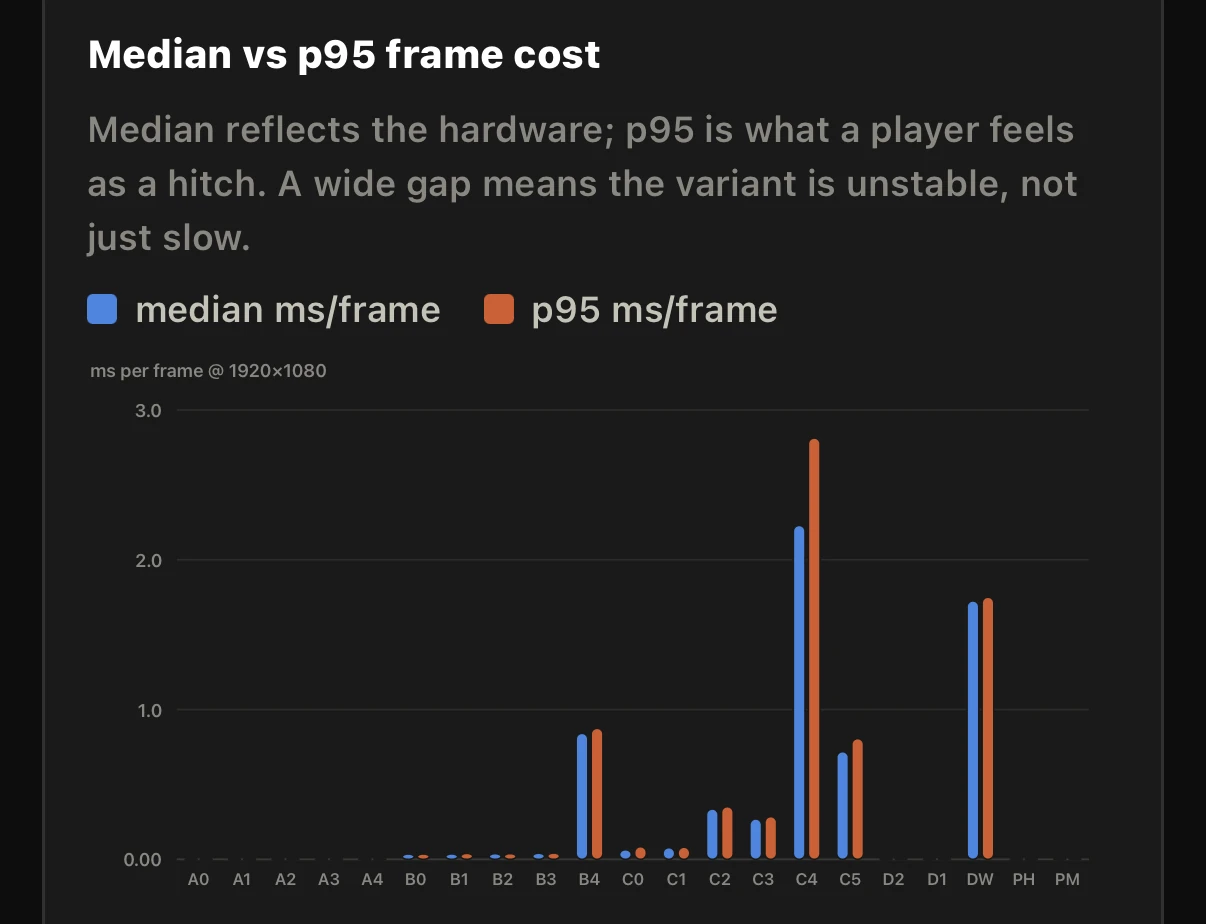
The extra render pass is where the curve breaks. Going from the unlit mesh to PBR with a shadow map costs 6.8 times more on the Android phone, 23.6 times on the iPhone and 13 times on the Mac. I wouldn't read that as "tilers hate shadow maps" just yet, because the jump mixes the shading cost with the extra pass. The pair that isolates the pass is B3 against B4, and I want that one in front of me, in raw milliseconds, before I say anything about tilers.
Draw calls were more interesting. One draw against 2,048 costs 2.9 times more on the Android phone, 8.3 on the iPhone and 10.3 on the Mac. Yet per extra draw the Android phone pays more, about 1.9 µs against 1.0 on the iPhone. The way I read it is that the Android phone is slower even with a single draw, so the ratio looks gentler. That's what a ratio does: it hides the thing you most want to see. From now on I keep the raw milliseconds next to every one.
Even a short run showed some heat. Between the first and last third of a window the iPhone drifted by 10%, the Android phone by 2.2% and the Mac by 5.4%. That says very little about sustained clocks. It only tells me where to look.
And two things I'm not going to quote, because they're wrong. The mediump card called a 7% slowdown on the iPhone a "genuine fp16 path", so the lab's own label lied to me. And the same effect in WebGL 1 and 2 came out at about 0 ms, while WebGPU said 1.7 ms. Both can't be true. That's this article happening to me one more time, and I'll fix it before I trust those rows.
What I'm taking back to the native port
The web numbers are not the engine's numbers. WebGL adds validation, IPC and a translator. But the shape of each curve carries over, and a web page costs minutes per new device instead of a day of engine instrumentation.
Four habits came out of it that I now use on the native work too:
- Know what your timer measures. Submission, completion and GPU execution are three different numbers. Say which one you're reporting.
- Never trust a limit or a feature from the chip name. Drivers, browsers and engines all clamp.
- Quote sustained, not peak. Set your targets after the phone is warm.
- Keep the context with the number. The lab exports a JSON with the renderer string, limits and extensions next to every result. A benchmark result without that is a rumour.
The last one is the same instinct as in Letting the game play itself: a claim is only worth something if a test, or a log, can back it up without me standing next to it.
If you're moving a renderer from an immediate-mode GPU to a phone, a small page like this is a cheap way to learn the shape of the problem before you start measuring the real thing.
The lab itself is my tool, built around my questions, so I'm only teasing it here. Yours will ask different ones, and you will probably need a slightly different tool. What carries over is the list above, not the page.
Need someone to look after performance?
If your game or your team needs someone to take care of performance, ask about my availability. I offer performance audits and porting as a service, and I specialise in mobile devices as a target for your game, including Nintendo Switch.